News, Information & Commentary

Support Ukraine
 The IDA adopted new Dark Sky Park designation requirements in June 2018 that not only specified a new minimum Sky Quality Meter (SQM) reading at the zenith of 21.2 magnitudes per square arcsecond or better, but additionally required any artificial light domes on the horizon to be “dim, restricted in extent, and close to the horizon.” So far, the only agency and process that has been able to show or measure this reliably has been the National Park Service using a complex and expensive data reduction scheme and high resolution camera system to map the whole night sky at current and proposed NPS dark sky sites. The complexity and expense of this system has been a significant constraint to making valid and reliable evaluations at non-NPS sites. 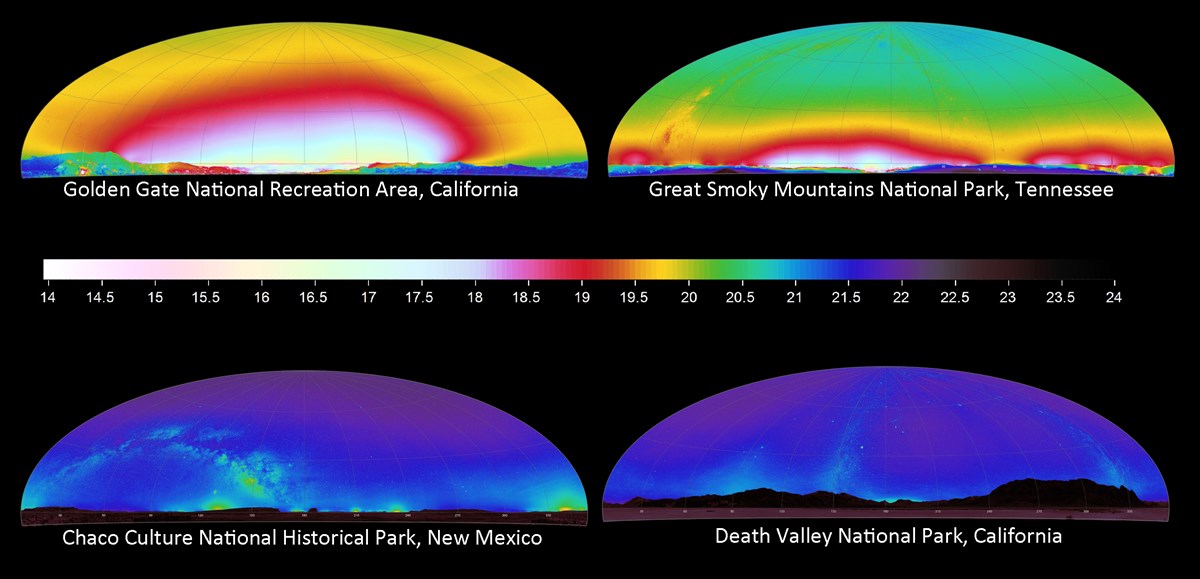 National Park Service. Bob Yoesle (recipient of an IDA 2015 Dark Sky Defender Award) and Micheal McKeag (IDA Oregon Delegate), amateur astronomers, dark sky advocates, and members of the Rose City Astronomers in Portland Oregon, have been working on devising a methodology for standardizing the process of assessment with simpler, more readily available and less expensive equipment and methods. This is needed for ongoing assessment of the scenic impacts of light pollution in the Columbia Gorge National Scenic Area, as well as proposed dark sky sites and communities both in the Pacific Northwest and around the world. Mike has used a high-quality wide-angle “fisheye” lens to do whole sky DSLR imagery, combined with Uniheadron SQM readings made on an alt-azimuth computer-controlled telescope mount. Unfortunately, due to the wide field of view of the SQM device, this has proved unsatisfactory for light dome measurements along the horizon: 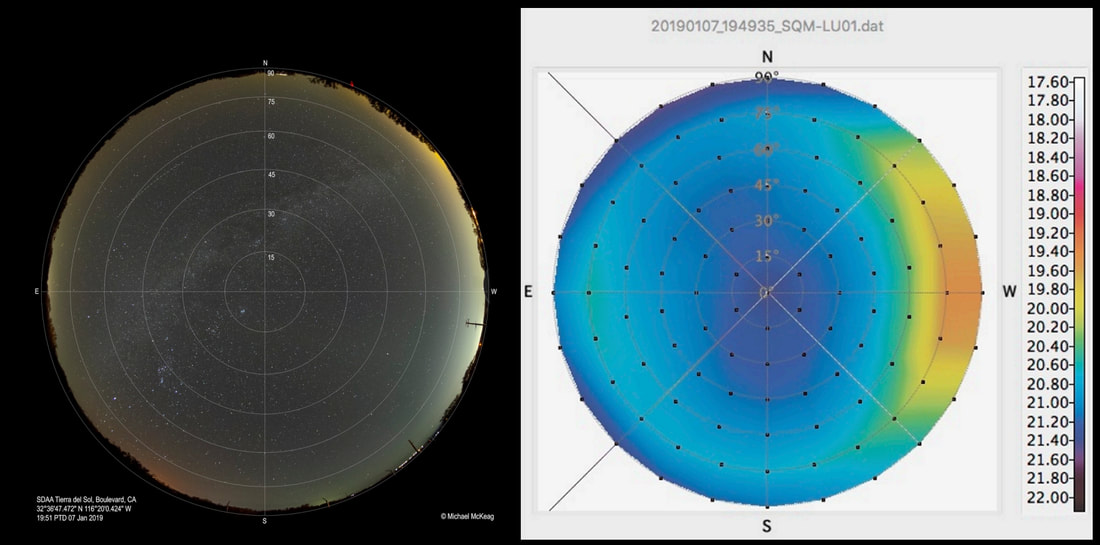
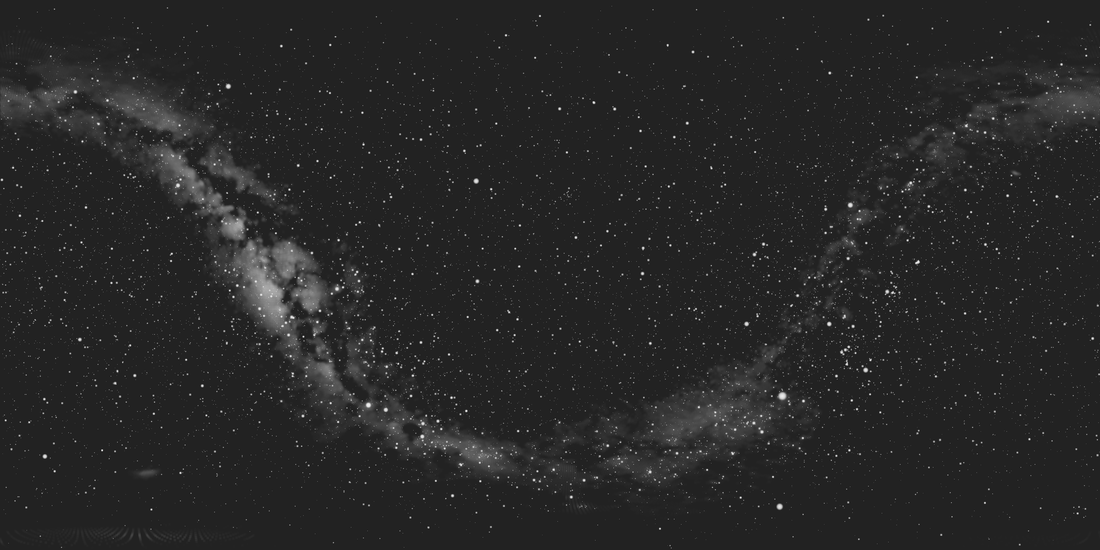
Until a narrower angle SQM with a field of sensitivity which will allow higher resolution and substantial enough improvements to be used in mapping horizon light domes comes along, Bob has devised and proposed a photographic methodology that directly compares light dome brightness to the brightness of the Milky Way, whose visibility is a key feature and requirement of any dark sky location. All that is required for this methodology is a fisheye lens all-sky imaging system of good quality. But you don't need a dedicated camera system - Bob used a sturdy photo tripod, DSLR camera, and one of the least expensive fisheye lenses available. The only other requirements are a digital photo processing program such as Photshop, Paint Shop Pro, etc. that allows histogram adjustment, and a planetarium program which is able to show azimuth and altitude angles of indicator stars above the horizon. This procedure is simple and affordable enough for amateurs astronomers and photo enthusiasts of all ages and skill levels to perform with minimal experience. The first thing to do is to take a picture that sufficiently exposes the night sky enough to capture the Milky Way: 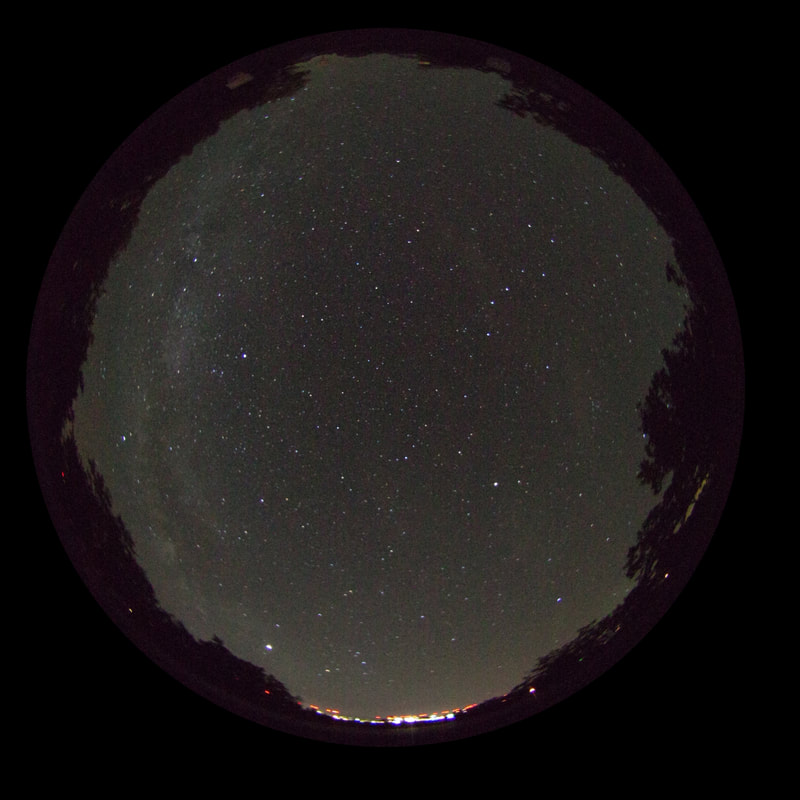 30 second exposure at ISO 3200 and f5.6. This image is then converted to a black and white “greyscale” image: 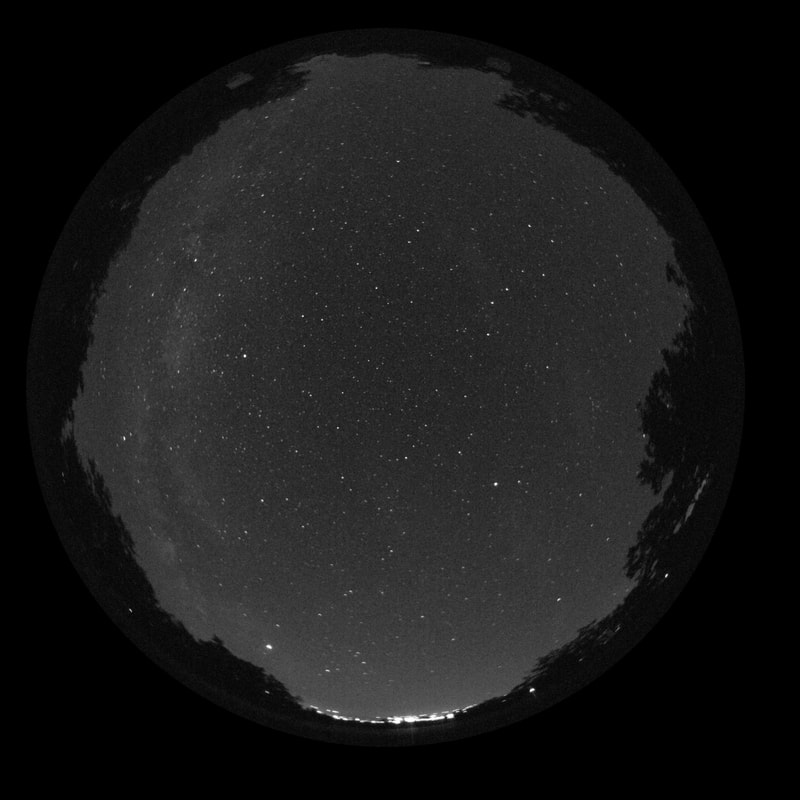 The image histogram is then adjusted to stretch midtones and suppress/eliminate the shadows and highlight regions of the image. This makes any light pollution much more evident and also enhances the brightness of the Milky Way to give a good set of comparison levels of brightness: 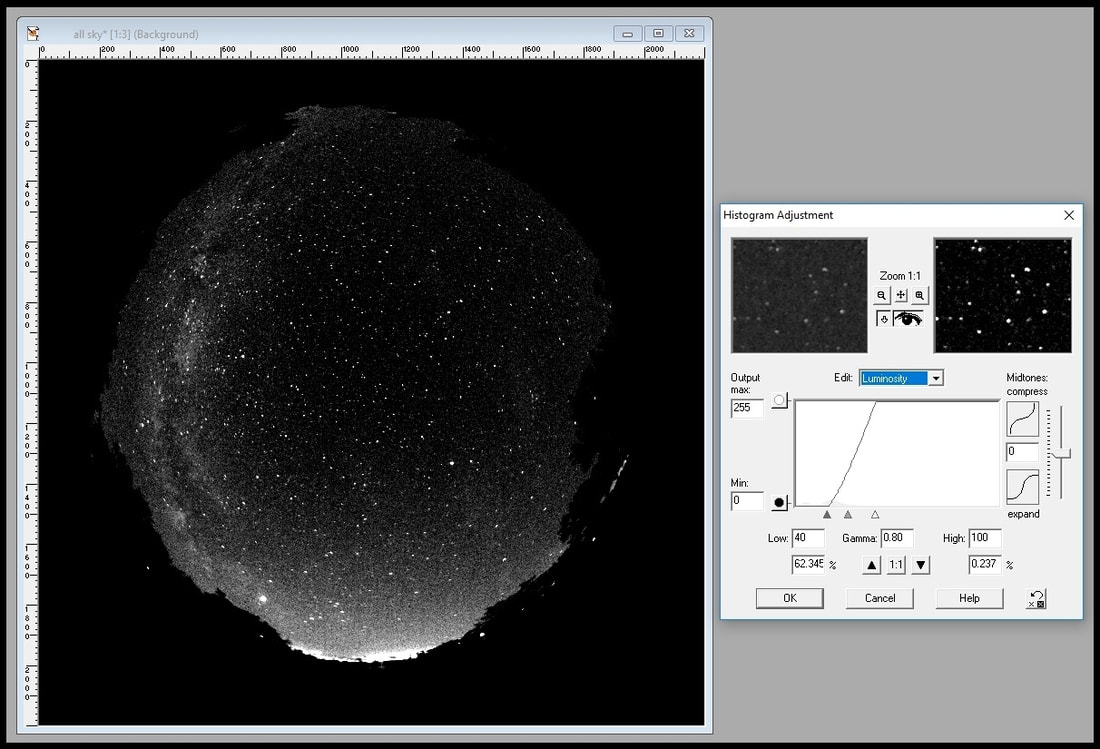 Using modified histogram settings to make adjustments to the image can highlight both the Milky Way and the extent of light pollution domes. This qualitative process requires different settings for varying exposures, yet appears to be a useful tool in extracting the true extent of artificial sky glow compared to the original image. Depending on the dynamics of the image, a negative image can sometimes provide better contrast to make the extent of faint levels of light more evident (our eyes often work better with black stars on a white background verus the opposite):  One of the limitations of using a wide angle fisheye lens for all sky imaging is the distortion and foreshortening of features which occurs near the horizon:  Using a planetarium program such as Stellarium (a free download), one can easily judge the extent of artificial brightness along the horizon and how far such artificial brightness reaches into the sky: 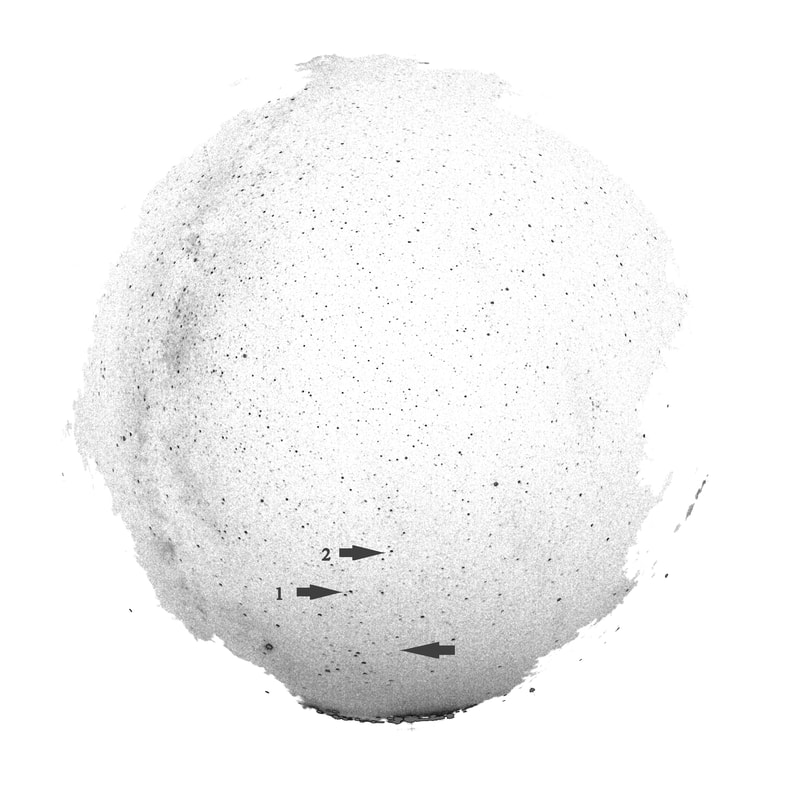 A qualitative exam of light dome extent. The unlabeled arrow points to β1 Sco at the top of the three pincer stars of Scorpius, arrow 1 lies between δ and ε Oph, and arrow 2 lies between α and ε Ser. These areas represent areas similar in brightness to the Milky Way going from the brightest to the dimmest discernible areas in the image. In this case we can see the altitude above the horizon for these parts of the light dome ~ 25, 40, and 50 degrees respectively: 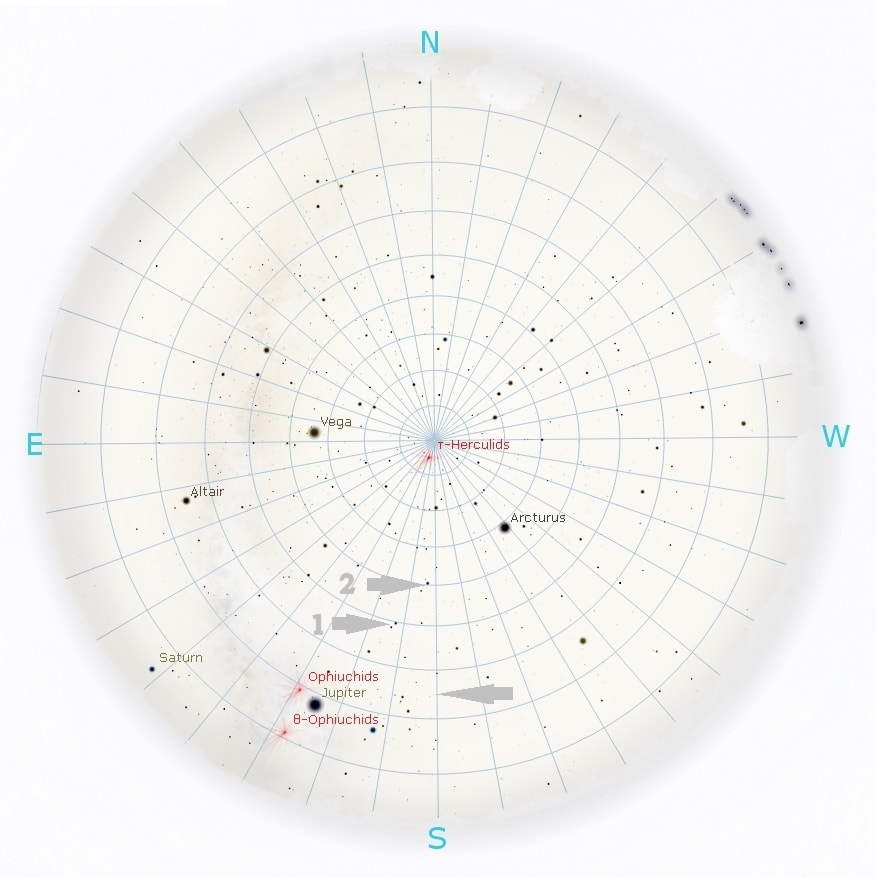 Around the new moon, a series of these images can be taken over a period of hours, days, or months to get a more valid sample of the site’s overall night sky quality. When combined with concurrent zenith SQM readings, the reliability of such a methodology can be readily established. Bob suggests use of a nearby Clear Sky Chart location or similar application prior to an imaging run to establish the general conditions locally under which the data and images are obtained:  Clear Sky Chart showing cloud cover, transparency, and sky darkness. 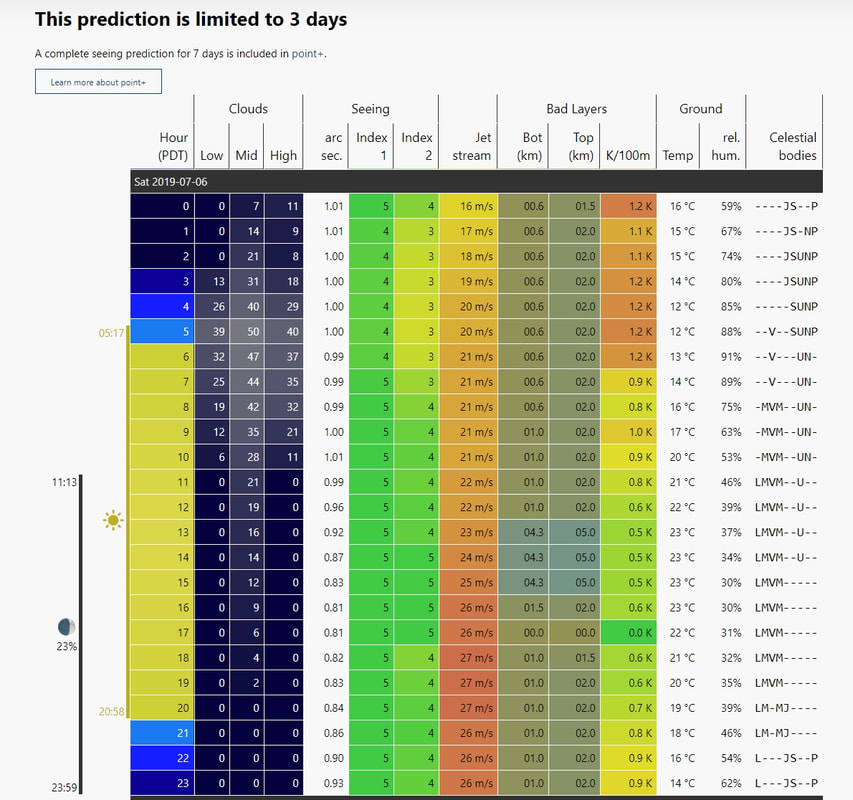 MeteoBlue Astronomical seeing forecast 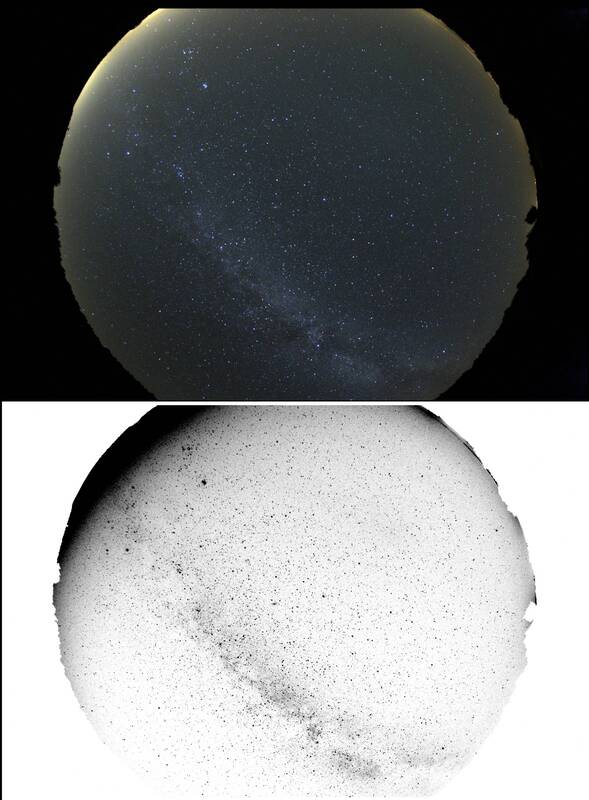 The IDA has responded favorably to this methodology for future dark sky site evaluations. Dark Sky Defenders welcomes contributions and refinements others may come up with to enhance or improve upon this methodology. Please use the Contact Page to send us your input and suggestions. Comments are closed.
|
Archives
July 2024
|
|
Donations to Dark Sky Defenders do not go to DarkSky International. Please contribute directly to DSI for donations and memberships.
|
|
 RSS Feed